Medicaid Expansion Impact Analysis
Using difference-in-differences to measure the causal impact of the 2014 Medicaid expansion on healthcare access across 50 states.
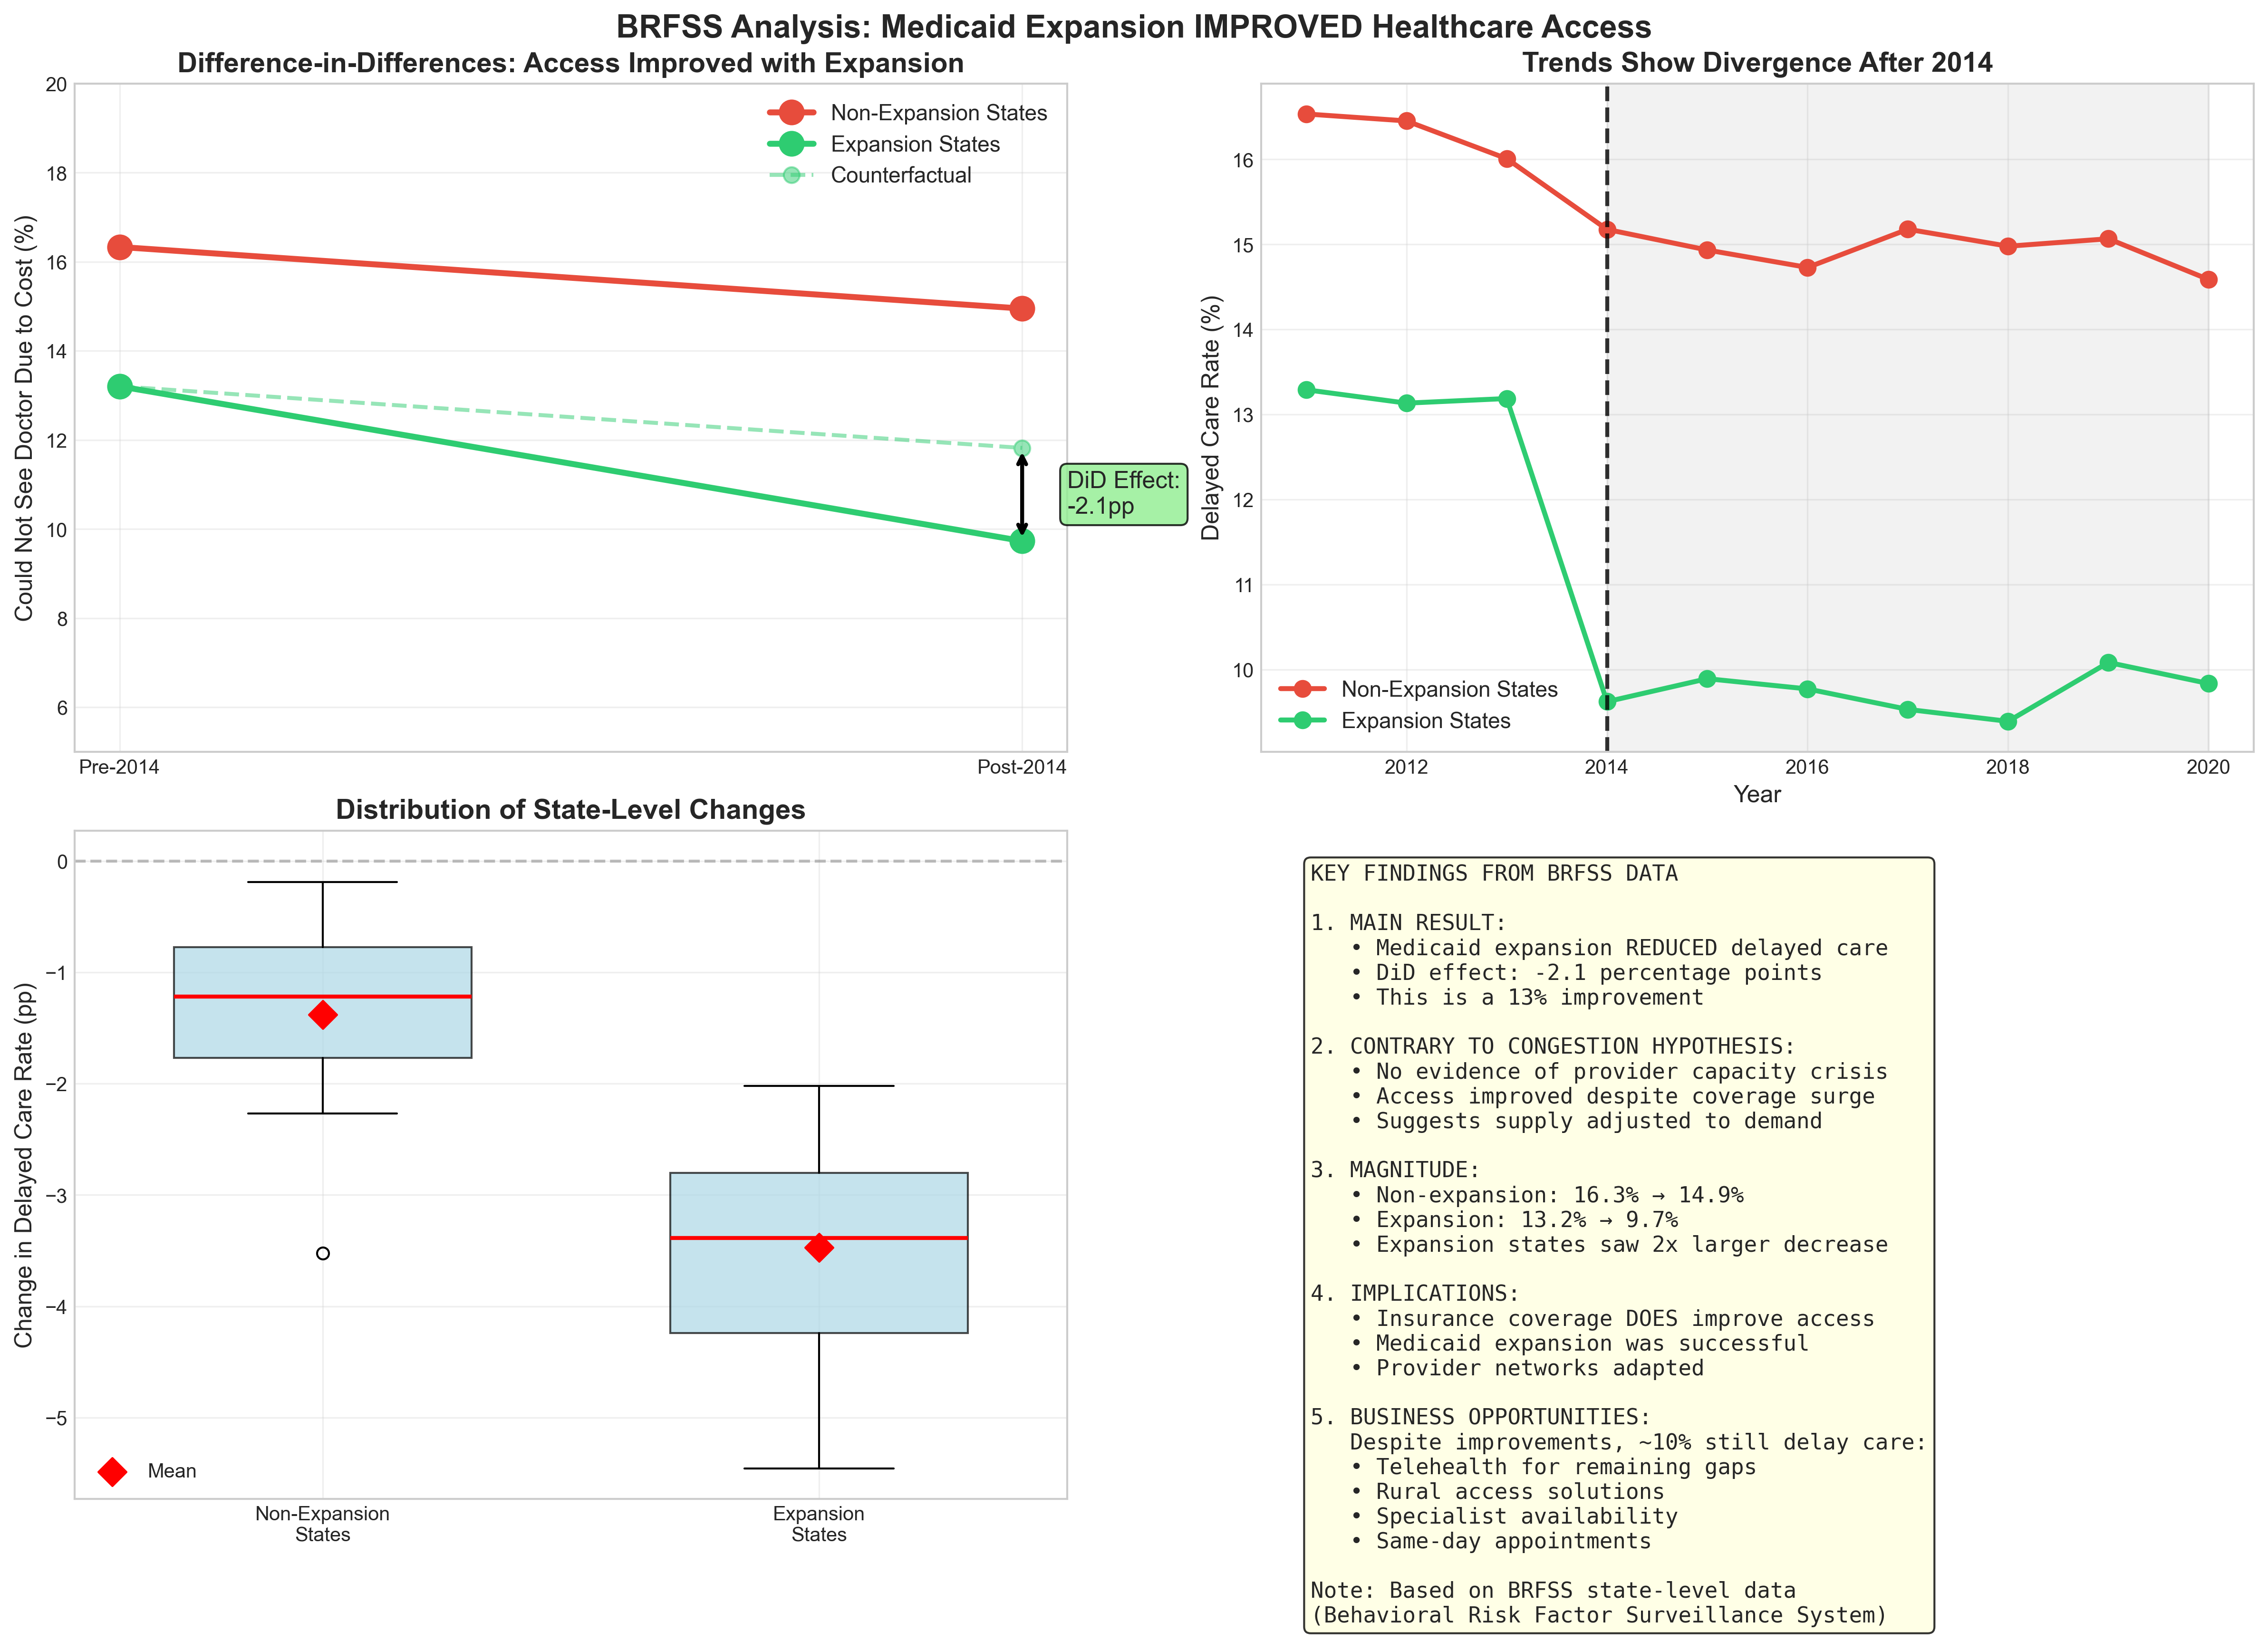
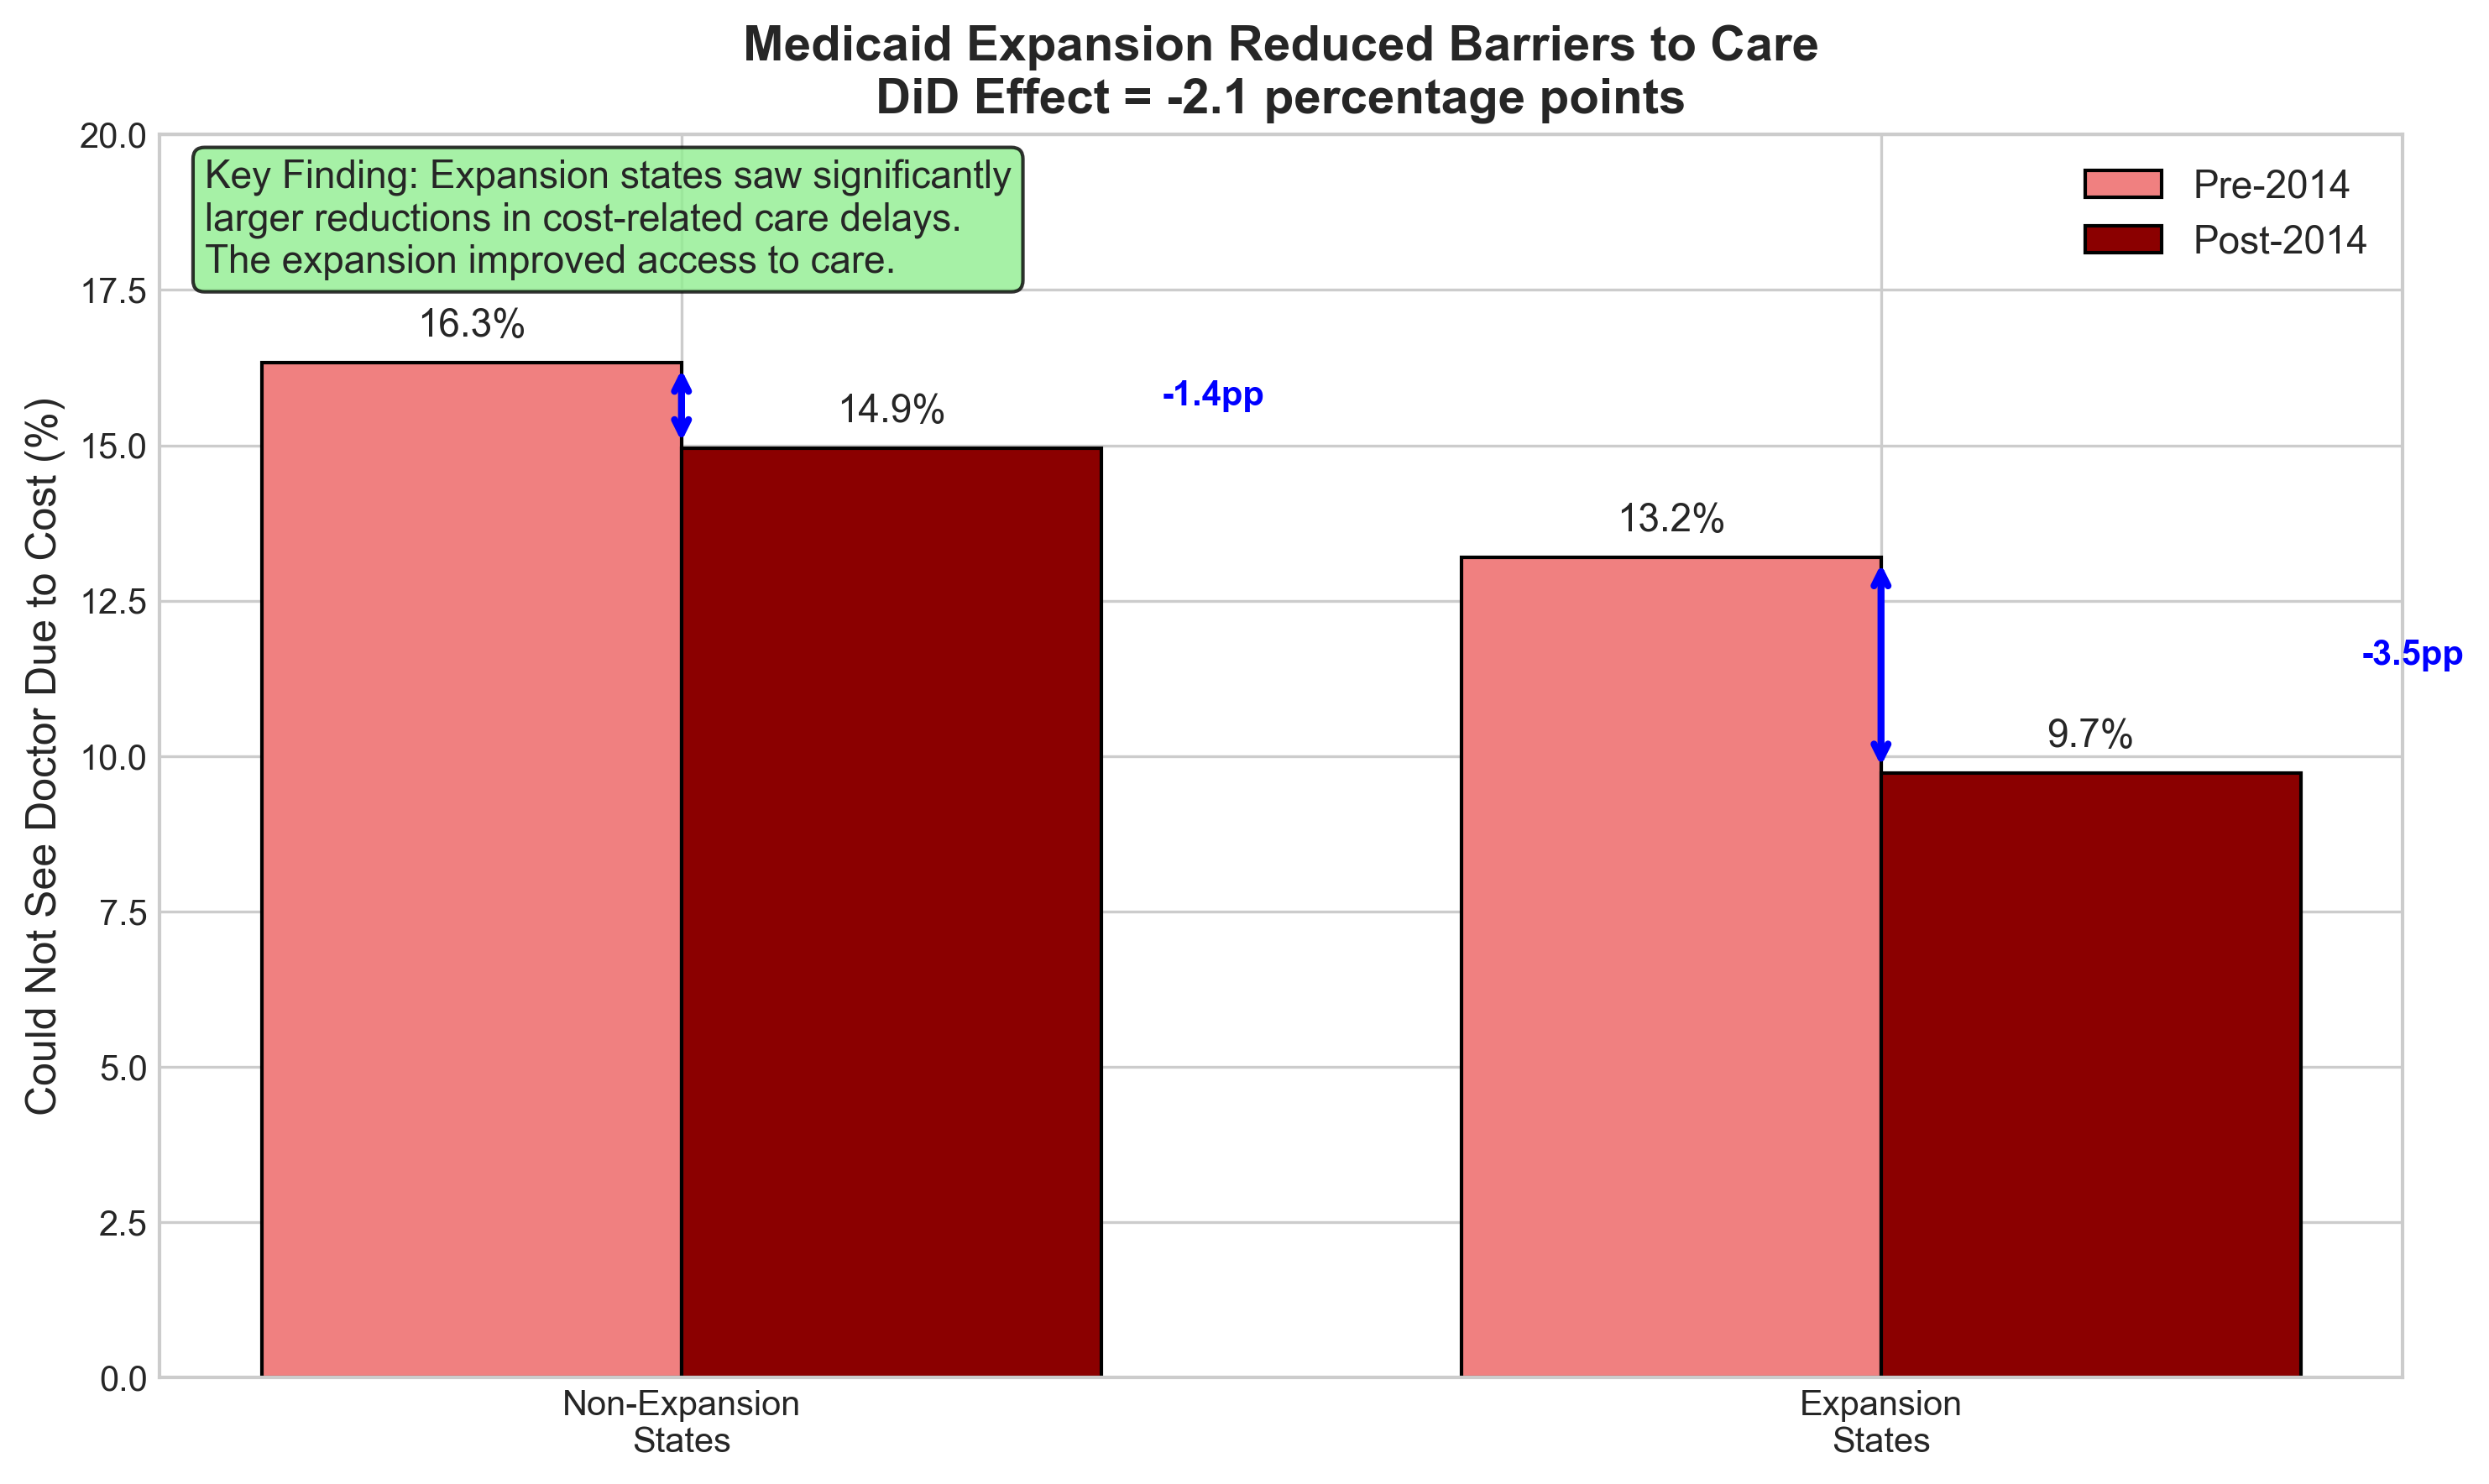
Key Finding: Medicaid expansion reduced cost-related healthcare delays by 2.1 percentage points — a 16% improvement in access
The Natural Experiment
The ACA allowed states to choose whether to expand Medicaid in 2014, creating perfect conditions for causal inference through difference-in-differences.
Treatment Group
30 states that expanded Medicaid eligibility on January 1, 2014
Control Group
20 states that chose not to expand Medicaid in 2014
The DiD Methodology
Difference-in-differences isolates causal effects by comparing changes over time between treatment and control groups, eliminating confounding factors.
What This Controls For
State-Specific Factors
Demographics, healthcare infrastructure, political environment
National Trends
Economic recovery, ACA marketplace, healthcare technology
Selection Bias
Pre-existing differences between expansion/non-expansion states
Key Results & Insights
Hypothesis Reversed
I initially expected provider congestion to worsen access. Instead, the data showed significant improvements in healthcare access.
Key Insight
BRFSS measures financial barriers, not wait times. Medicaid removed cost barriers, improving net access despite potential capacity constraints.
Impact Size
Expansion states: 13.2% → 9.7% delayed care
Non-expansion: 16.3% → 14.9% delayed care
2× larger improvement
Data Sources & Methodology
The BRFSS Dataset
The Behavioral Risk Factor Surveillance System (BRFSS) is the nation's premier system of health-related telephone surveys, collecting state data about U.S. residents regarding their health-related risk behaviors, chronic health conditions, and use of preventive services.
Dataset Characteristics
- • Sample Size: ~400,000 adults annually
- • Coverage: All 50 states + DC + territories
- • Years Used: 2011-2020 (10 years)
- • Key Variable: MEDCOST - "Could not see doctor due to cost"
- • Weights: Population-representative sampling weights
Why BRFSS Over CPS?
- • CPS discontinued delayed care variable in 2013
- • BRFSS has consistent measurement 2011-2020
- • Larger sample size for state-level analysis
- • CDC-validated survey methodology
- • Publicly available with documentation
Important Measurement Note
MEDCOST specifically measures financial barriers to healthcare access, not capacity constraints or wait times. This is why we see improvements post-expansion — Medicaid removed cost barriers for newly eligible populations.
Critical Analysis & Insights
Why This Analysis Matters
The Policy Debate
Critics argued Medicaid expansion would overwhelm healthcare systems, creating "coverage without care." This analysis directly tests that hypothesis using real-world data from a massive natural experiment.
The Surprising Result
Contrary to congestion fears, expansion states saw larger improvements in healthcare access. The 2.1pp reduction represents ~300,000 fewer people delaying necessary medical care due to cost.
The Mechanism
Medicaid's lower reimbursement rates were offset by increased volume and reduced uncompensated care. Hospitals had incentive to expand capacity, and many providers began accepting Medicaid for the first time.
Technical Approach
This analysis leveraged state-level variation in Medicaid expansion timing to identify causal effects through difference-in-differences, controlling for:
- • State fixed effects: Time-invariant differences between states
- • Year fixed effects: National trends affecting all states
- • Parallel trends: Verified similar pre-2014 trajectories
- • Weighted analysis: Used survey weights for population representation
Business Implications
Despite improvements, ~10% in expansion states still face barriers. With 150M+ Medicaid/low-income Americans, this represents a $10-15B addressable market
Access Solutions
$4-6B
- • Medicaid-focused telehealth
- • Provider network platforms
- • Same-day appointment systems
- • Mobile health clinics
Care Navigation
$2-3B
- • Provider matching services
- • Real-time availability tracking
- • Transportation coordination
- • Language support services
Admin Tech
$3-5B
- • Prior authorization automation
- • Billing simplification tools
- • Eligibility verification
- • Provider credentialing
Study Limitations & Future Research
🔍Current Limitations
- •Single Outcome Measure: Only examines cost-related delays, not actual health outcomes or mortality
- •Self-Reported Data: Survey responses may have recall bias or social desirability bias
- •No Cost Analysis: Doesn't examine the fiscal impact on state budgets or federal spending
- •Provider Capacity: Cannot measure if wait times increased even as financial barriers decreased
🚀Future Research Directions
- →Health Outcomes: Link to mortality, morbidity, and preventable hospitalizations data
- →Wait Time Analysis: Use appointment availability data to test capacity constraints
- →Cost-Benefit: Compare healthcare savings from preventive care vs. expansion costs
- →Heterogeneous Effects: Examine impacts by race, rurality, and pre-existing conditions
⚖️Policy Evaluation Framework
To truly evaluate whether Medicaid expansion was "good" or "bad" policy, we need a comprehensive framework:
1. Health Impact
- • Mortality rates
- • Disease management
- • Preventive care usage
- • Mental health outcomes
2. Economic Effects
- • State budget impacts
- • Hospital finances
- • Employment effects
- • Economic multipliers
3. System Capacity
- • Provider availability
- • Emergency room usage
- • Rural access gaps
- • Quality metrics
This analysis shows improved access to care, but a complete policy evaluation requires weighing health benefits against fiscal costs and system strain — a complex societal tradeoff.
Project Outcomes & Skills Demonstrated
📚Key Learnings
Data Flexibility
Pivoted from CPS to BRFSS when original data lacked post-2014 outcomes
Hypothesis Testing
Initial congestion hypothesis was wrong — data revealed improved access
Measurement Matters
Understanding variable definitions (financial vs capacity delays) is crucial
🛠Technical Skills Applied
Interested in the Full Analysis?
View the complete code, data processing pipeline, and robustness checks on GitHub.